
We have released GaitForce v1.2.0, which adds some of our most requested features, including result comparison and a report feature (Beta).
New Timeline
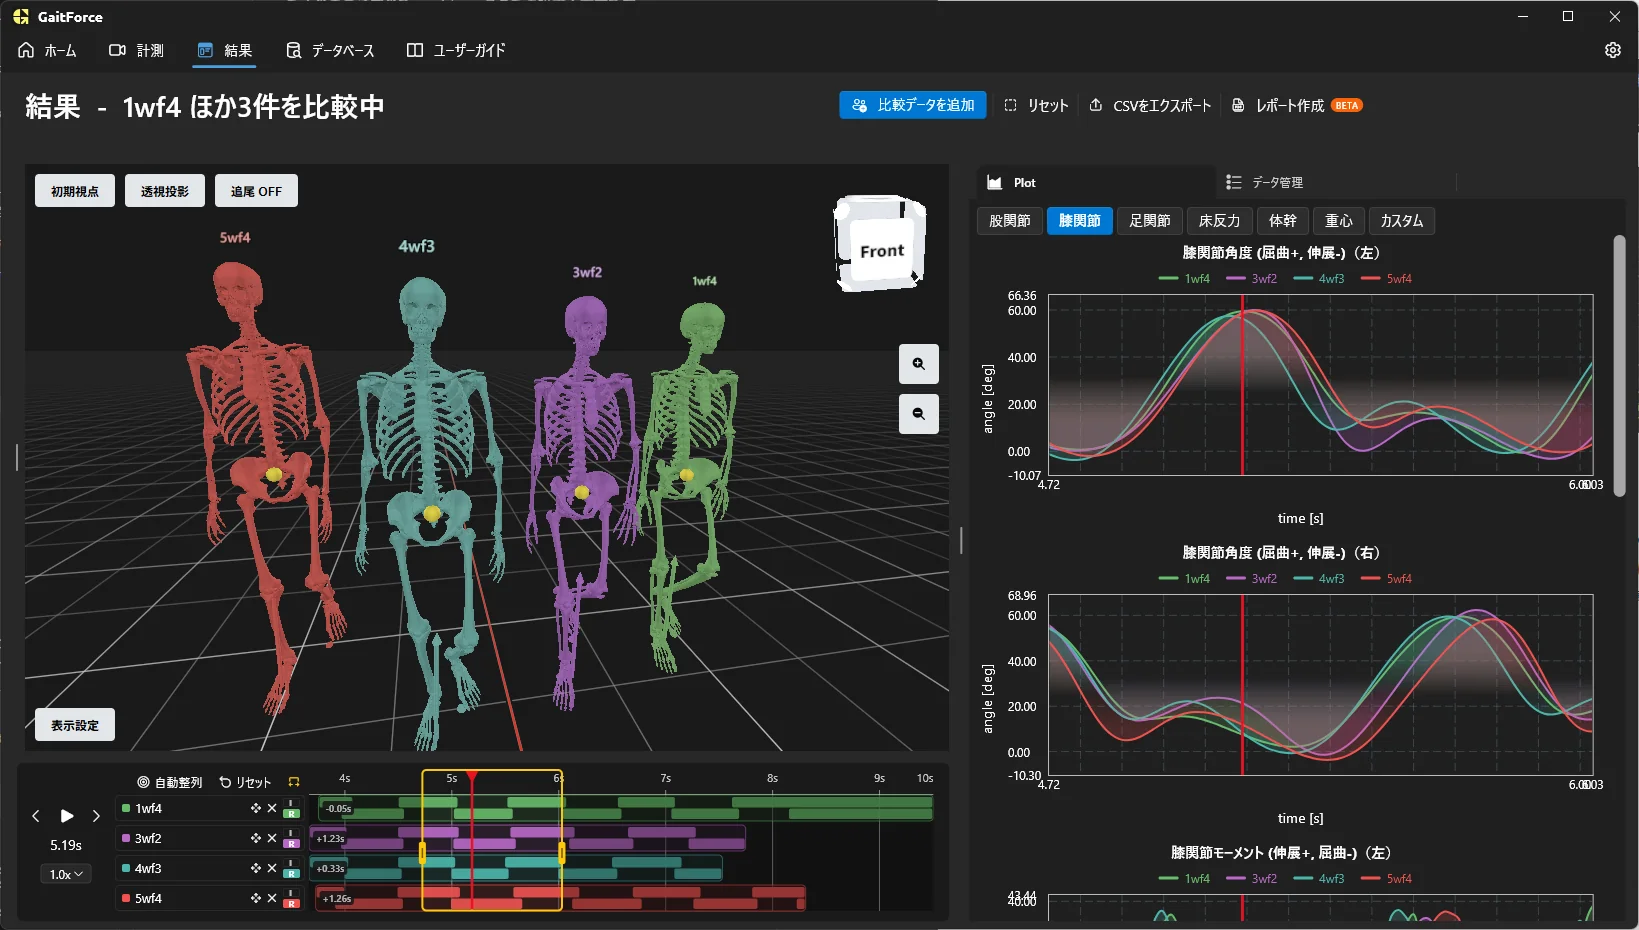
The interface for playing back analysis animations and stepping through frames has been redesigned.

The timeline now visualizes the ground contact of each foot, giving you an intuitive picture of the gait at a glance. By adjusting the time range shown as a yellow frame, you can play back and plot only the time span you want to focus on. This is useful when a recording contains many steps, or when you want to analyze only the range where walking speed is stable.
Comparison Feature
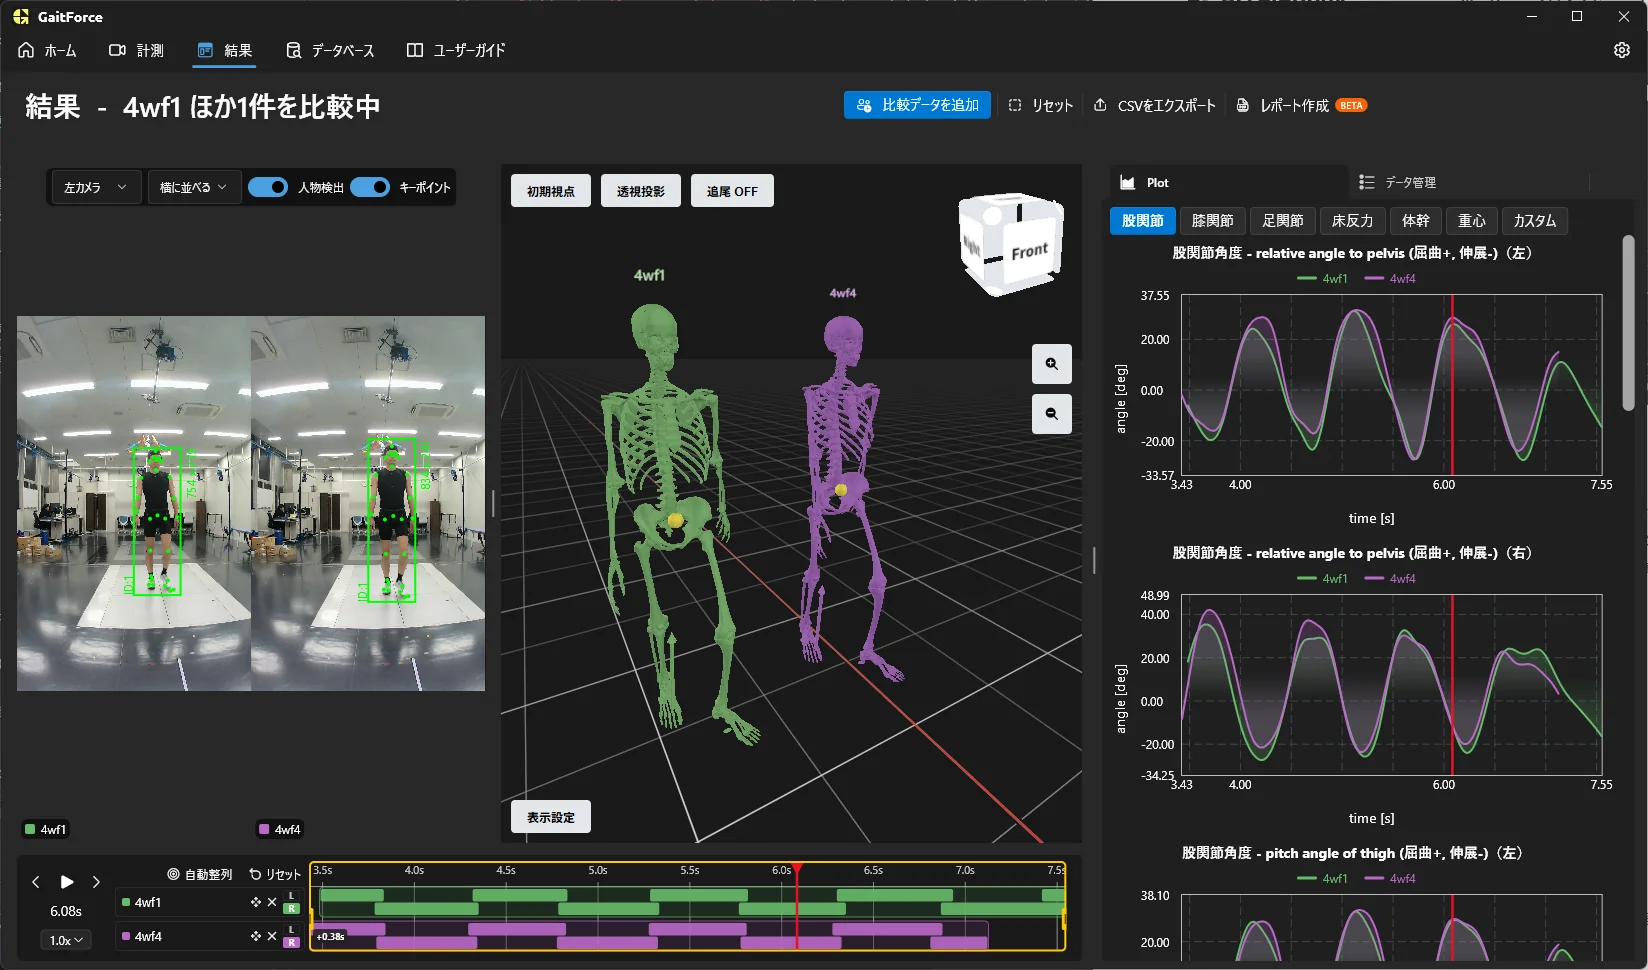
You can now display multiple analysis results on a single screen and compare them. Results can be shown side by side, or overlaid as semi-transparent models. Each dataset is color-coded, making visual comparison of movements easy. This is useful for before/after treatment comparisons or comparisons between subjects.
New 3D View Options
In the 3D skeletal model view, you can now toggle the display of the body’s center of mass and draw its trajectory.
The skeletal model can also be rendered semi-transparent or as a stick figure. 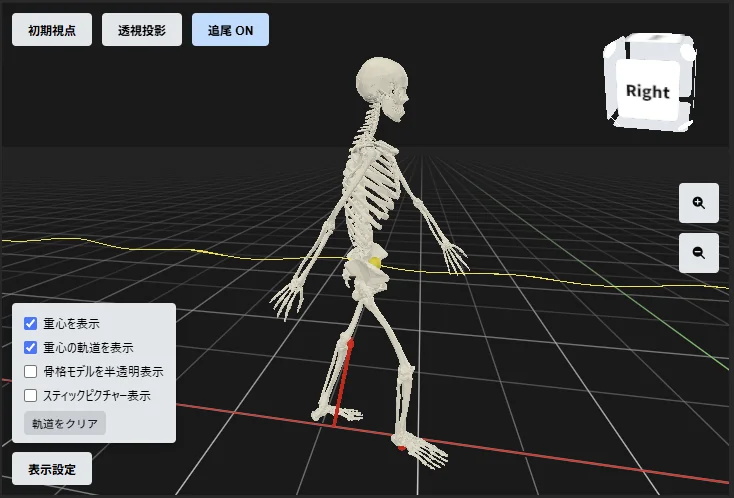
Redesigned User Guide
The user guide has been reworked from a PDF into a web-page format. It is bundled inside GaitForce, so you can consult it whenever you need it — including in offline environments without an internet connection.
Report Feature (Beta)
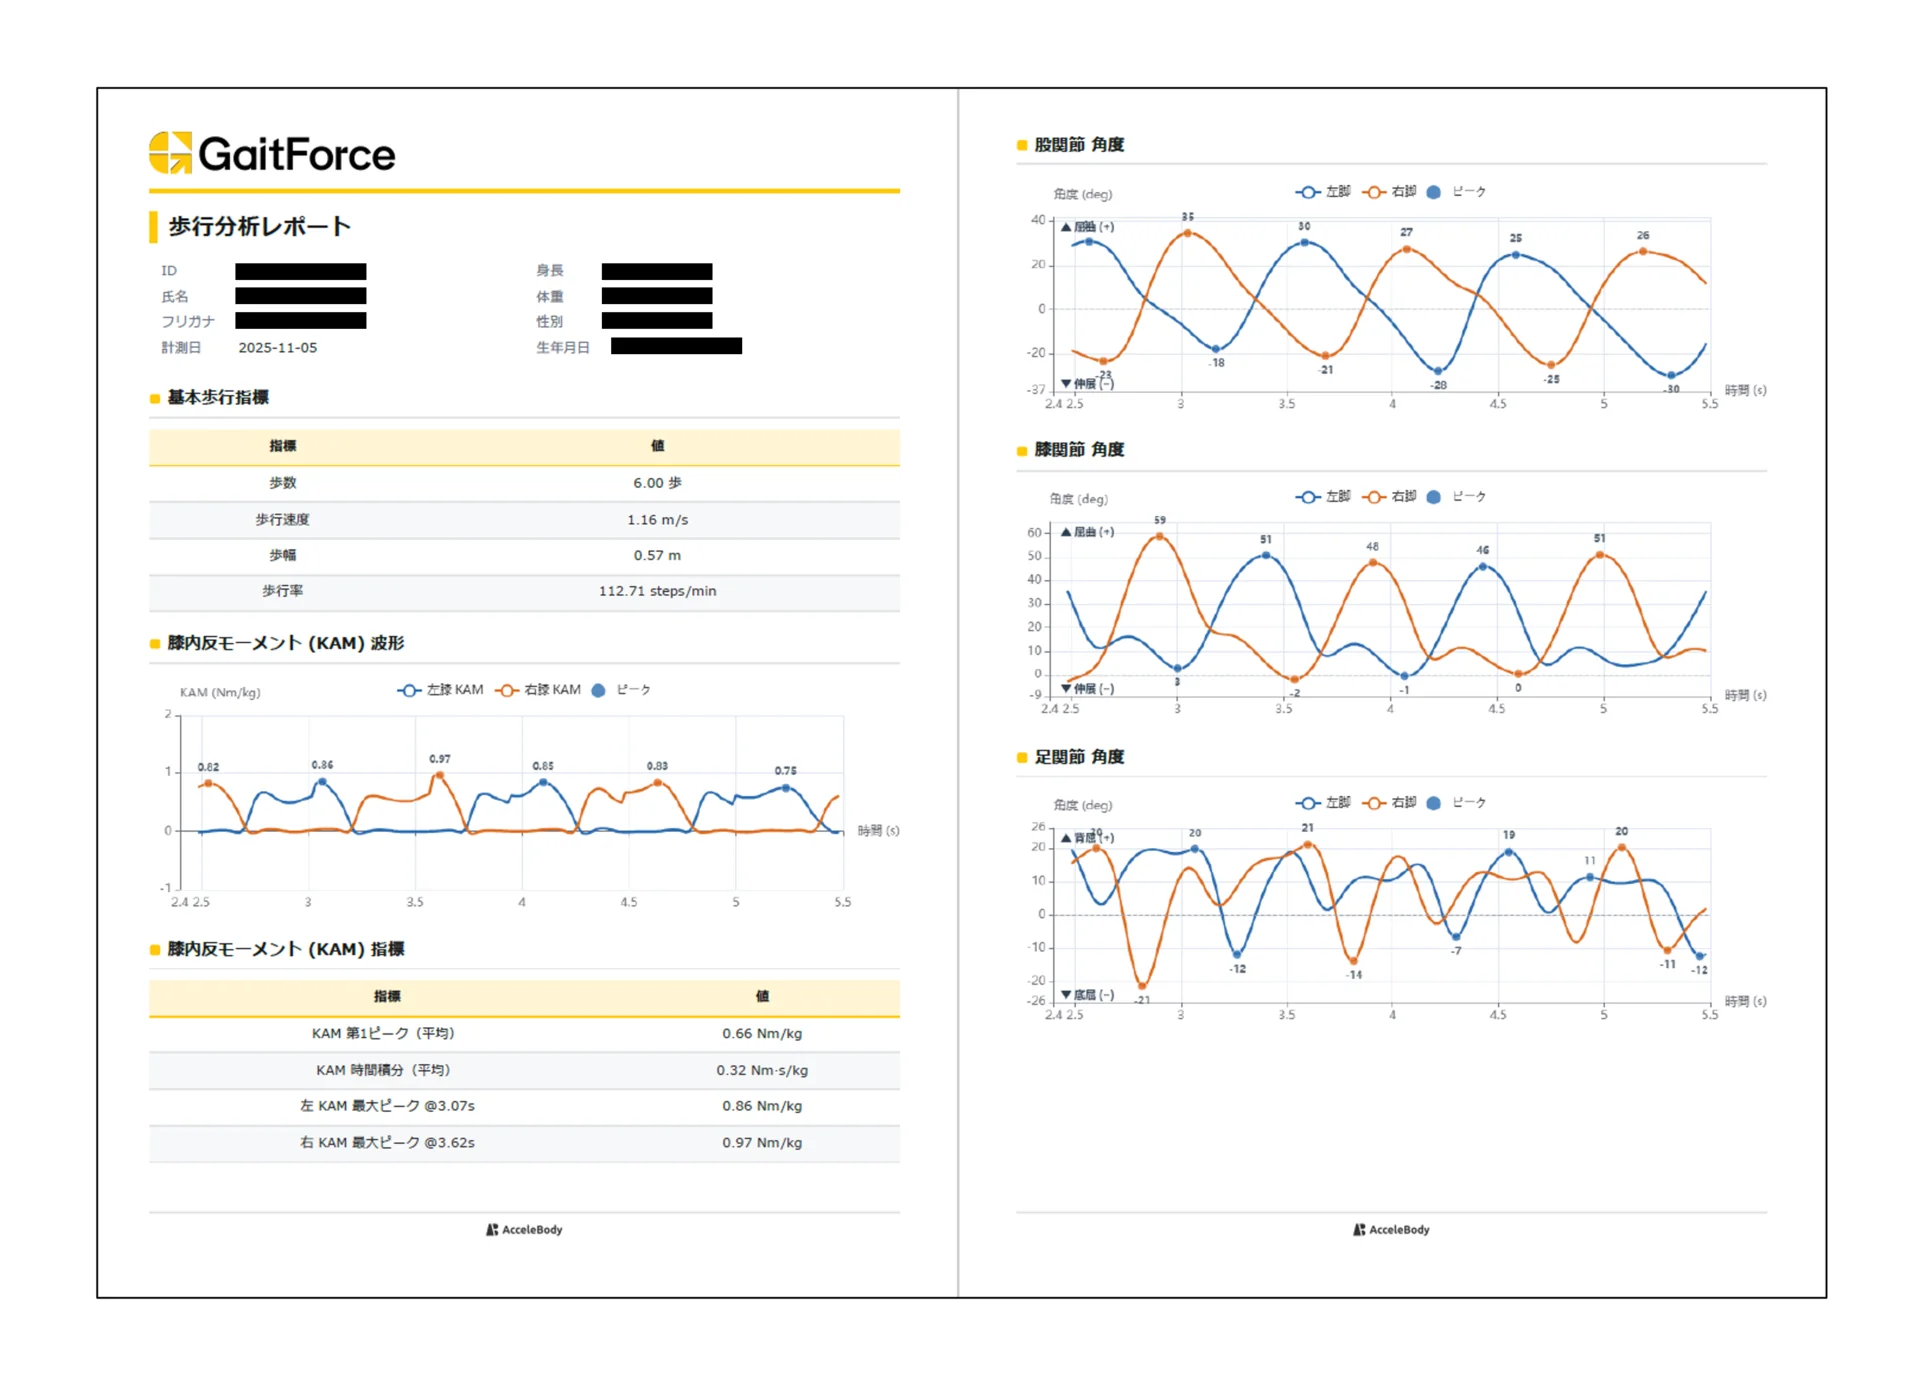
GaitForce can now automatically generate a report that computes representative metrics from a gait measurement and summarizes them in tables and charts. Reports can be saved as printable PDFs. You can configure which information to include, and save your report layouts for reuse. This feature is in beta and includes experimental elements. We plan to keep improving it so that it provides information that is genuinely useful in clinical practice.
Other Changes
- Chart sign conventions now follow the standard practice in biomechanics. You can switch back to the previous style in the settings.
- When exporting data, calibration files (.toml) and analysis result files (.abd) are now saved along with the video files.
- Improved stability at startup (fixed issues such as the whole screen turning white on launch).
- Various UI design refinements.
Planned Updates
We will continue to improve accuracy and develop useful features.
- Selecting the time range to analyze
- Normalization by gait cycle
- Labeling arbitrary time points and exporting them to CSV
- Comparison against normal gait
- Report feature improvements (longitudinal comparison, explanatory notes, and more)
Please note that the release schedule may change depending on development progress.